
Monte Carlo Analysis of WeFunder Results – Q4-2018
In the fourth quarter of 2018, WeFunder posted updated investment results for their 2013-2016 vintage of equity crowdfunding deals (Reg D).
While the summary boasts some promising numbers thus far, such as a 41% IRR and 3.3X return multiple (unrealized), there is a lot more that we can learn from this data.
We constructed a Monte Carlo simulation in Python for equity crowdfund investment returns, and used the WeFunder 2018 data to simulate potential returns for varying portfolio sizes. While the results presented below are only the tip of the iceberg, we believe there are some lessons that can immediately be applied to anyone’s equity crowdfunding portfolio.
Two of the biggest takeaways from the Monte Carlo analysis of WeFunder results are:
- Diversification: understanding how the number of investments in your portfolio statistically impacts your expected returns
- Power Law Returns: ensuring that your screening filters and due diligence aren’t excluding the potential big winners (i.e. unicorns)
Here are CrowdWise, we are striving to provide you with the hard data based on real numbers, so that you can apply these probabilities and potential outcomes to your investment decisions.
Now, let’s get into the numbers.
Monte Carlo Analysis – WeFunder Results
The Monte Carlo Analysis simulates an investor who makes random picks from the database of 119 Reg D WeFunder startups to date. The inherent assumption is that no one can know which companies will be the big winners ahead of time, and so any company that passed the WeFunder screening process to be posted on their website was a candidate for investing.
We ran the simulation for investors holding from 1 to 350 investments in their portfolio (in increments of 5), to look at the potential returns. At each number of investments, we ran 2000 simulations and recorded the investment outcomes, and plotted the results in the charts below.
Mean and Median Returns vs. Portfolio Size
The first chart shows the expected return multiple for investors as a function of the number of equity crowdfunding investments in their portfolio.
As expected, the mean hovers around 3.3X, the same average return advertised on the WeFunder results page.
Looking at the median returns – median meaning that an equal quantity of results lie above and below that value – we can see that the investor’s portfolio achieves enormous benefits from adding additional startups to the portfolio up to ~80, and then the median chart levels out.
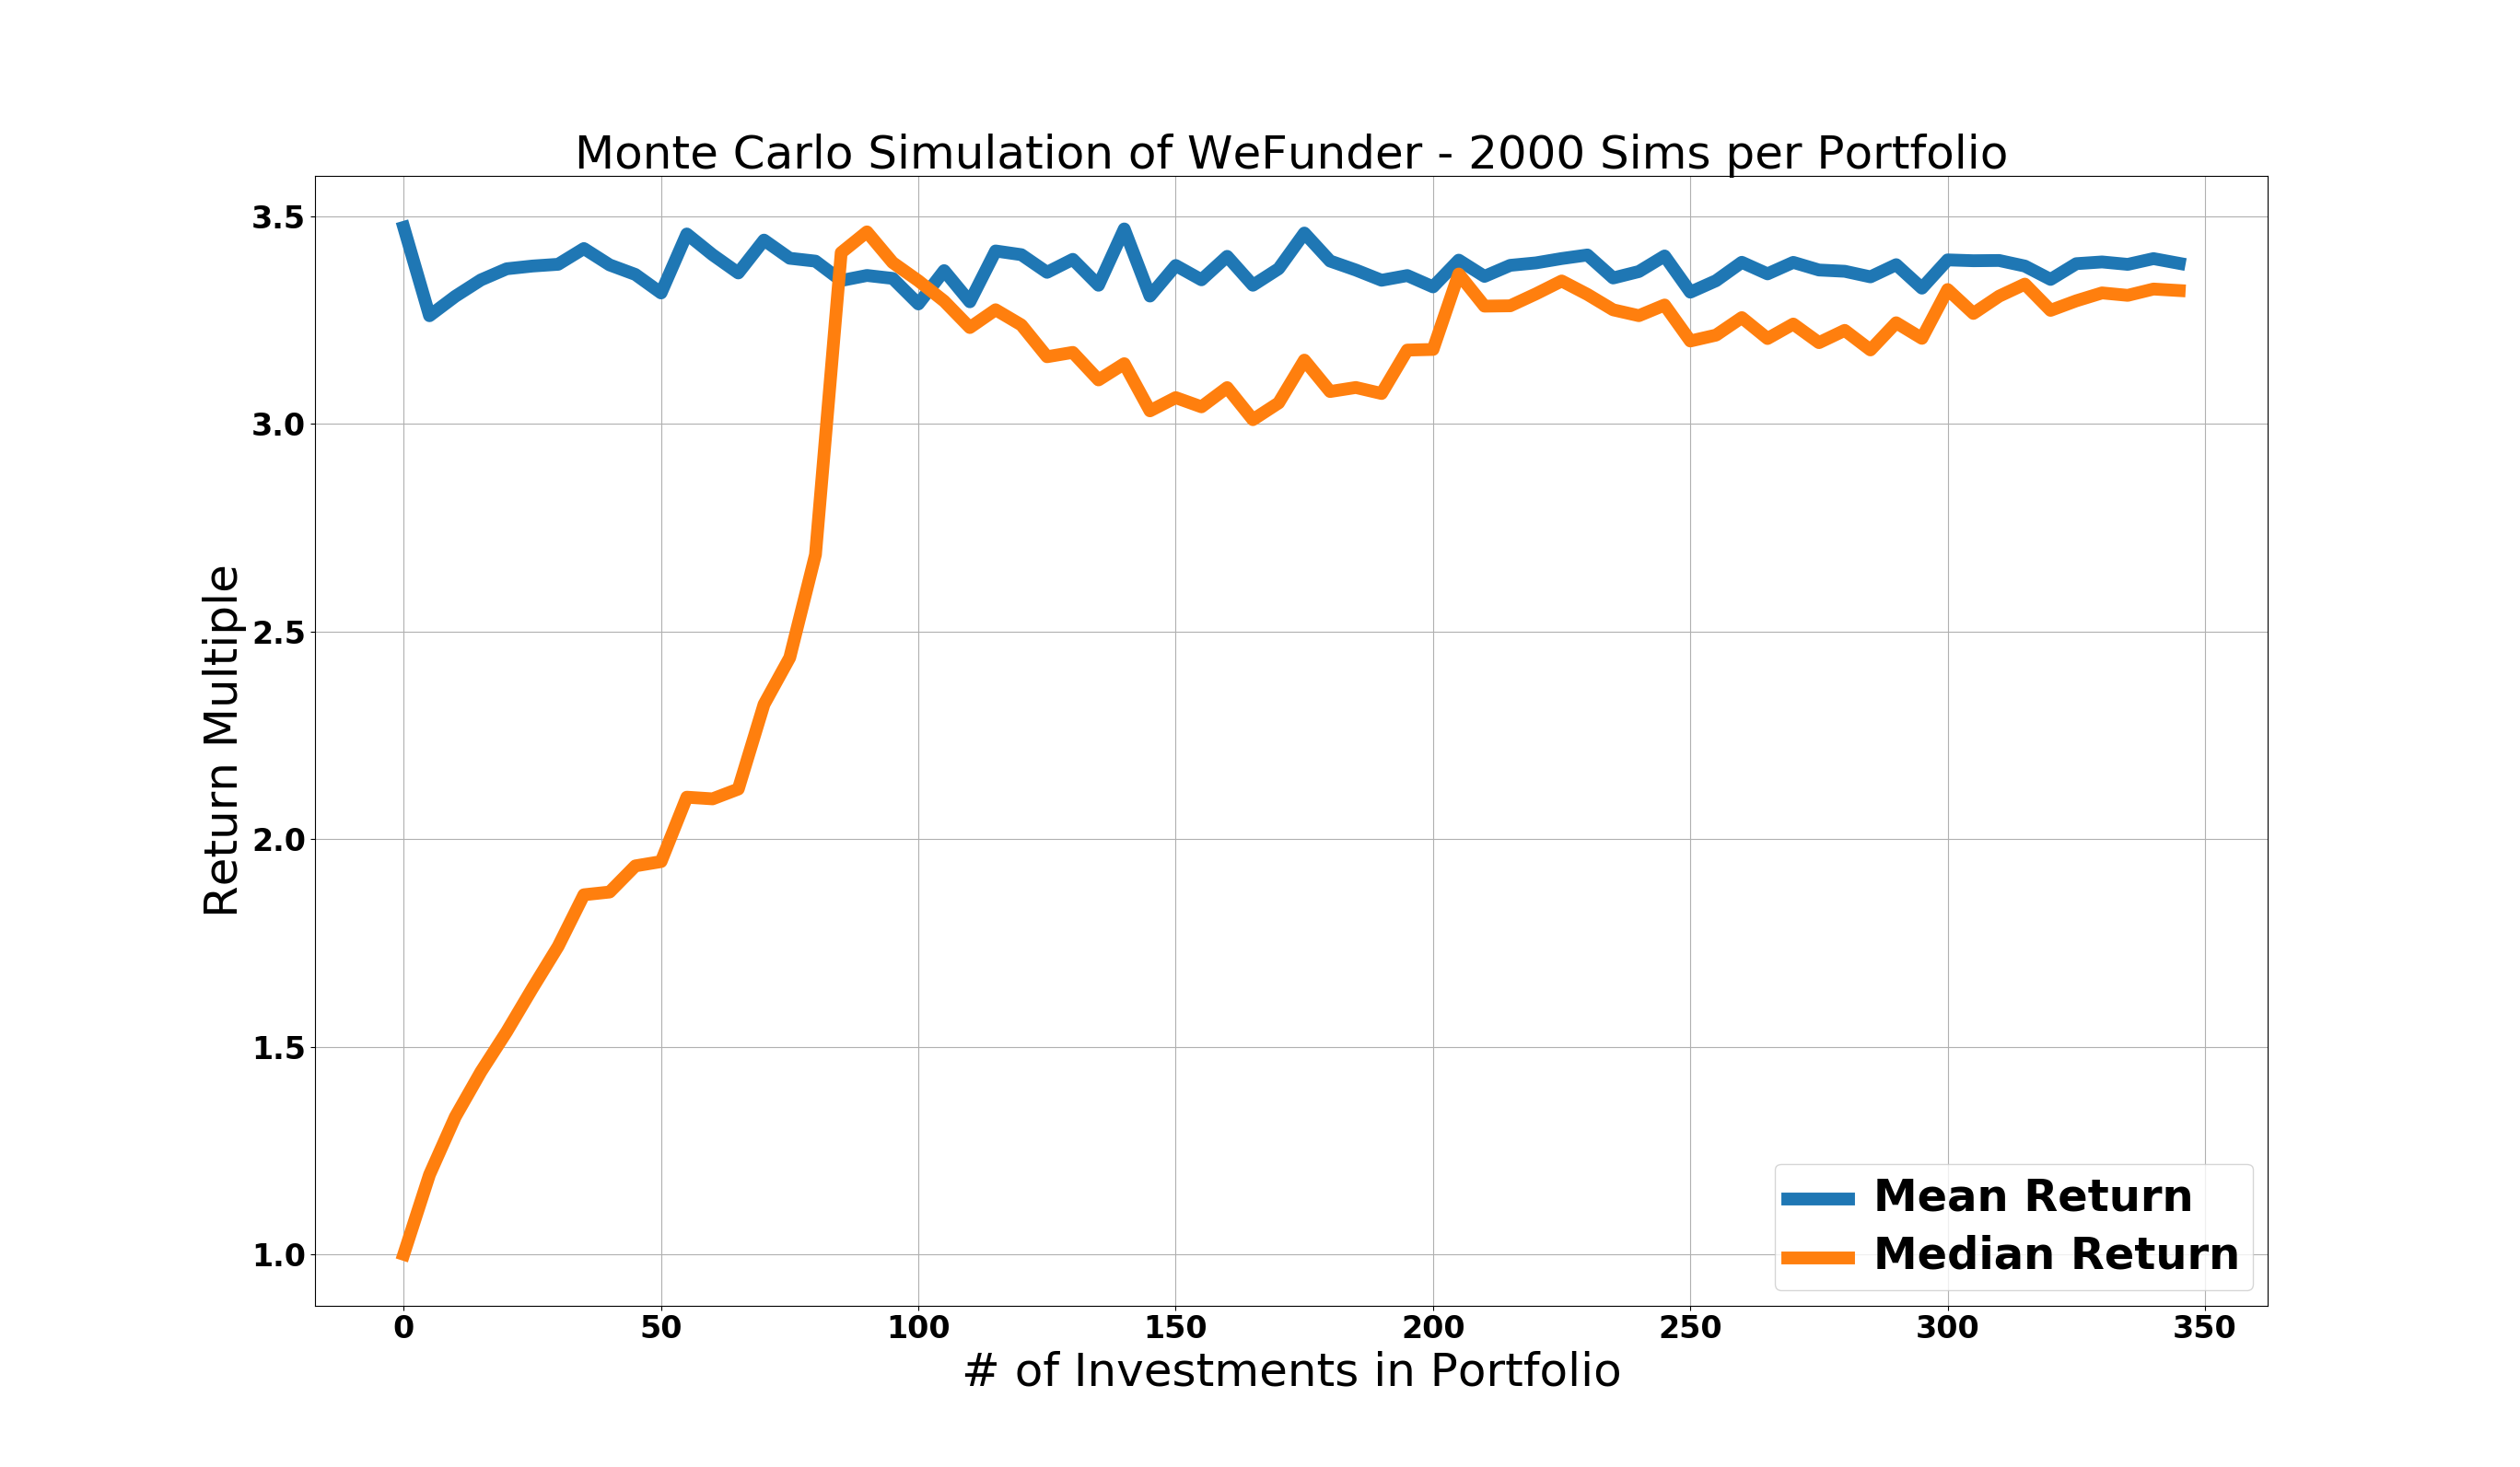
While the mean expected returns (blue line) for an investor are roughly constant, the median returns (orange) increase up to roughly 80 investments. This means that more investors continue to get larger returns up to a portfolio size around 80 investments. Then, the number of people above the mean of 3.3 and below the mean levels out to be roughly equal.
Still, this doesn’t show us enough of the details in terms of probabilities for portfolios of given sizes to return certain amounts. Let’s analyze potential return probability vs. number of investments.
Portfolio Returns vs. Number of Investments
The following chart presents the probability at each investment portfolio size (n=2000 simulations) to return greater than 1X, 2X, 3X, and 5X the invested capital.
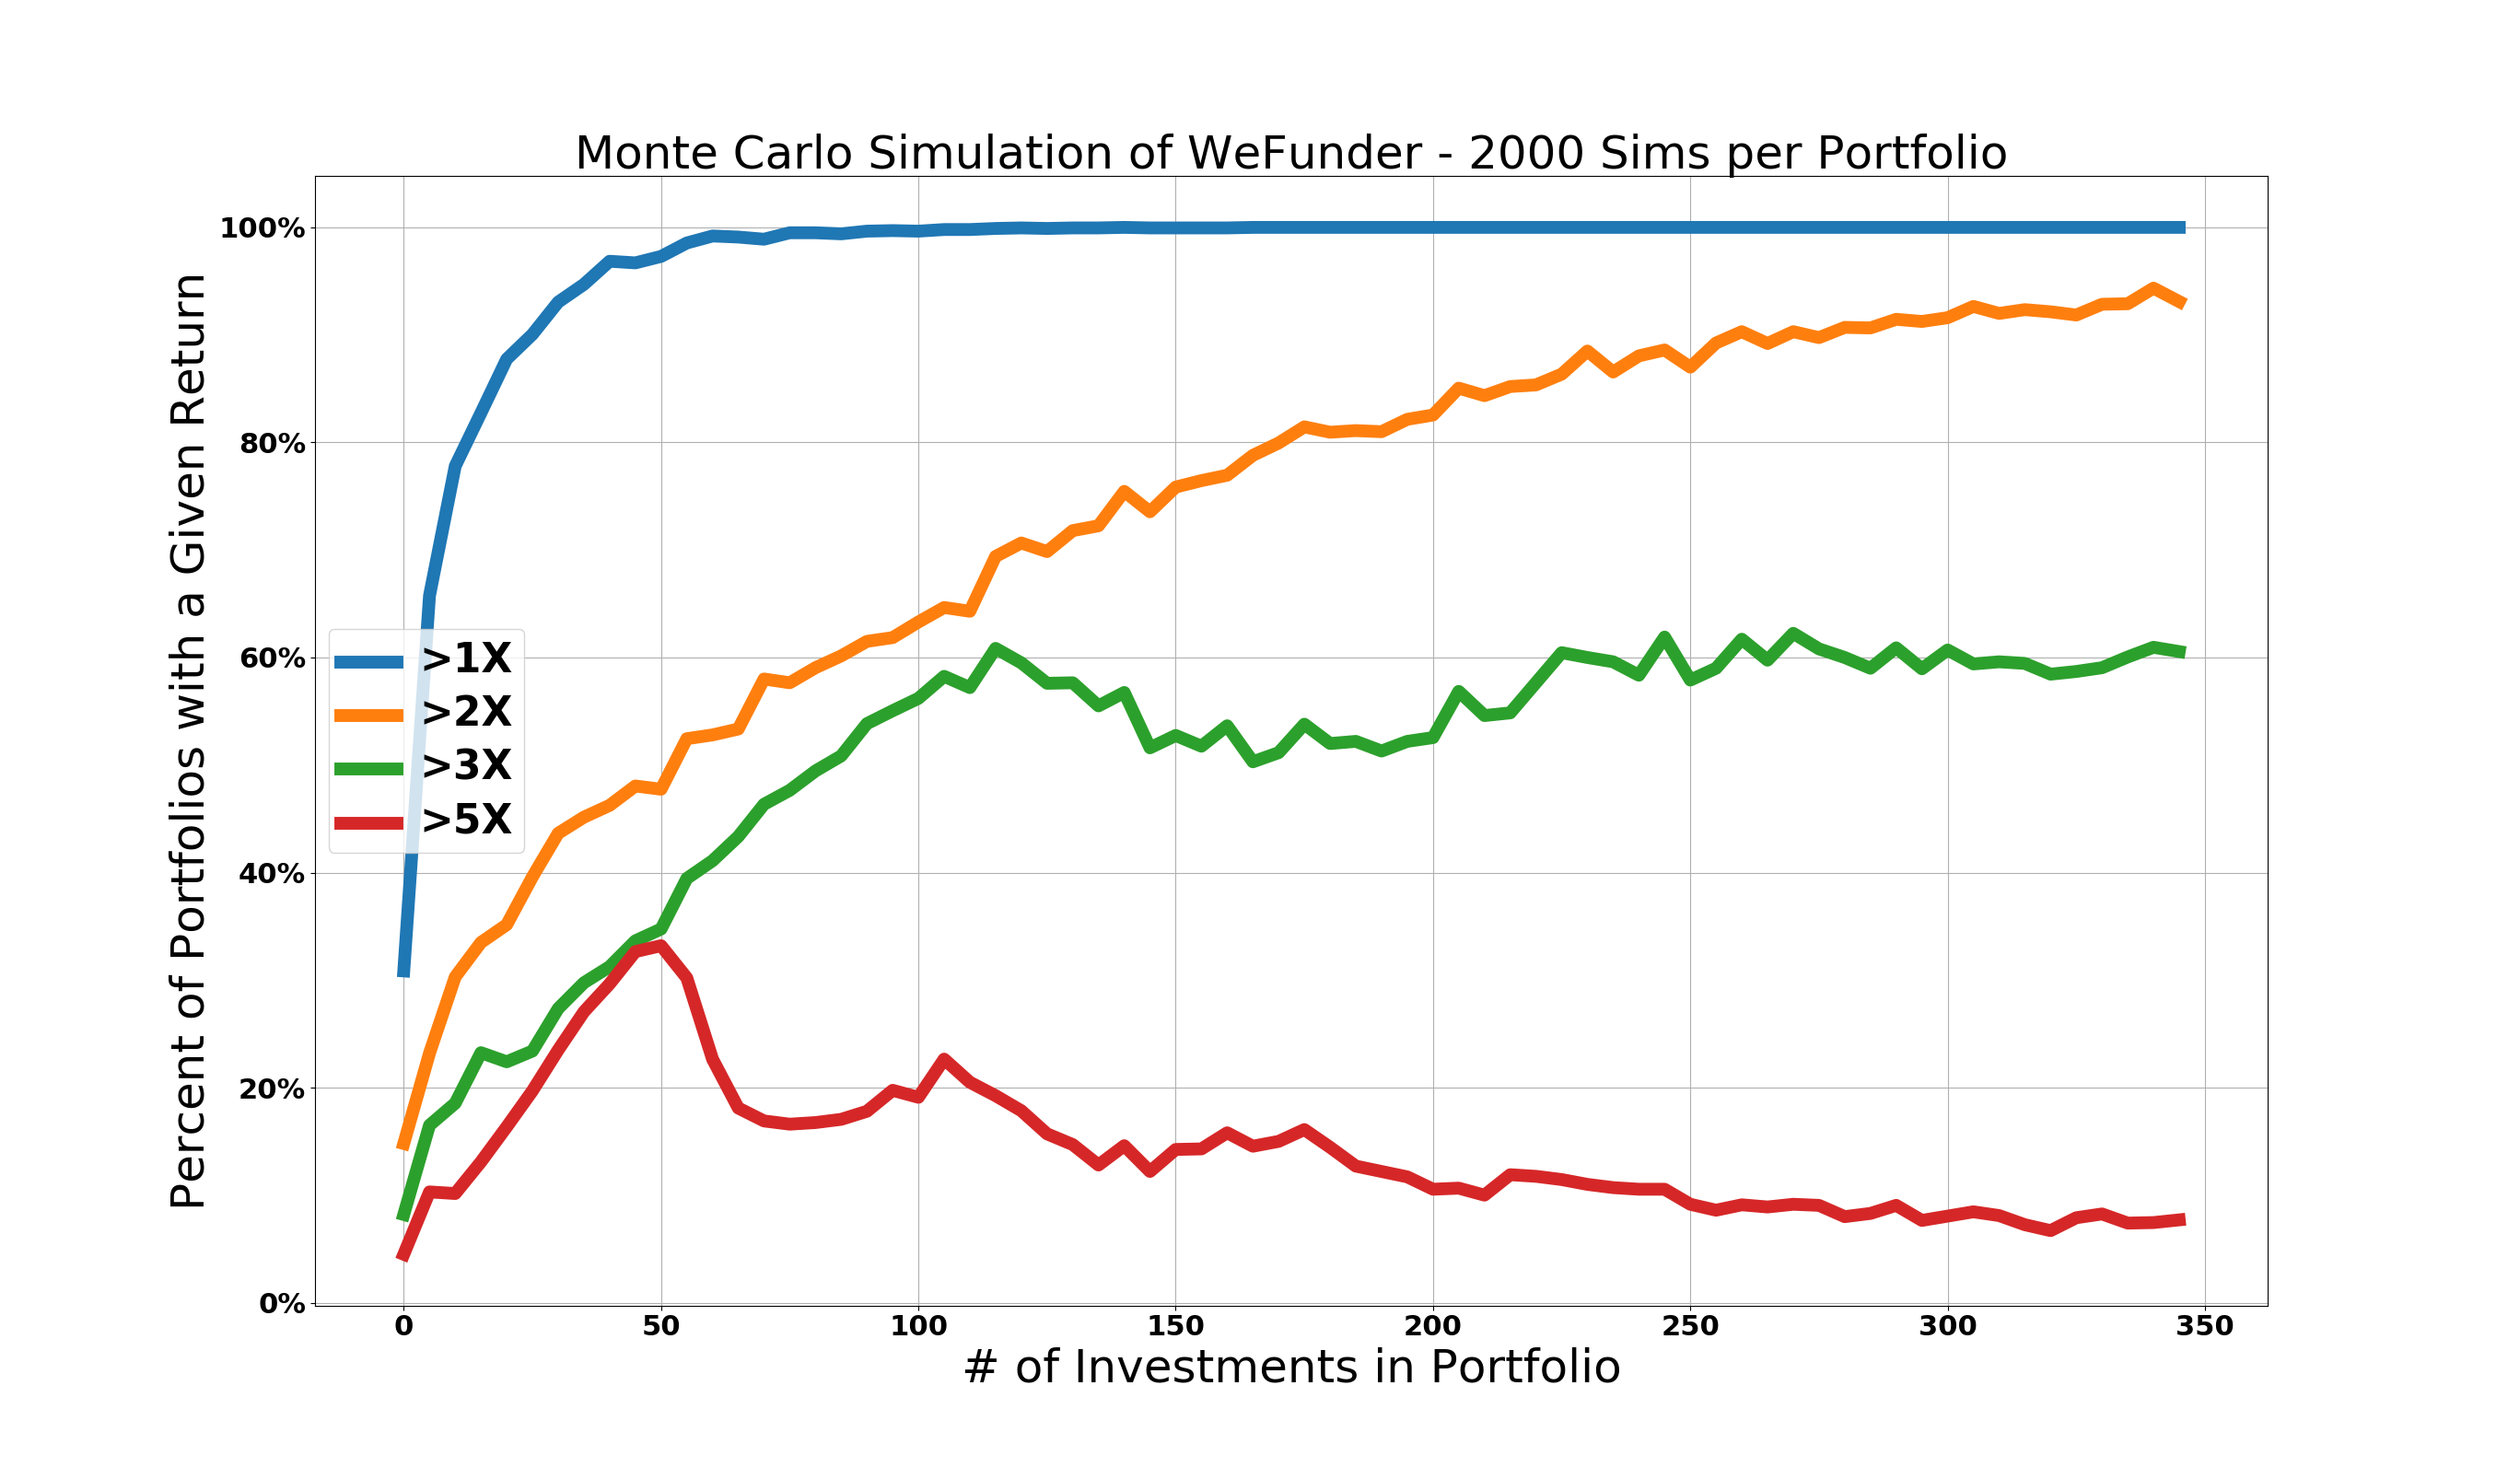
As can be seen, to achieve a 95% confidence in at least breaking even (>1X), the WeFunder dataset requires a minimum of 50 investments in the portfolio.
To achieve an 80% confidence of getting at least 2X returns, a minimum portfolio size of roughly 175 investments is required, which is larger than the current dataset of 119 companies.
Because the mean of the dataset is 3.3X, the probability of achieving over a 3X return levels out around 60%, with a portfolio size of at least 120 investments or greater. This makes sense, since the Zenefits returns of 206X account for nearly 50% of overall returns, and the odds of selecting that one company are 1 in 119.
If your desired outcome is to achieve greater than the mean of the dataset (e.g. >5X), then the highest probability for >5X returns peaks around 50 investments, but then decreases with increasing investments.
This is because having one of the big winners like Zenefits in a portfolio smaller than the size of the dataset has an outsized impact on overall returns. However, as the following chart will show, you also have a higher chance of returning less than the mean the smaller your portfolio is.
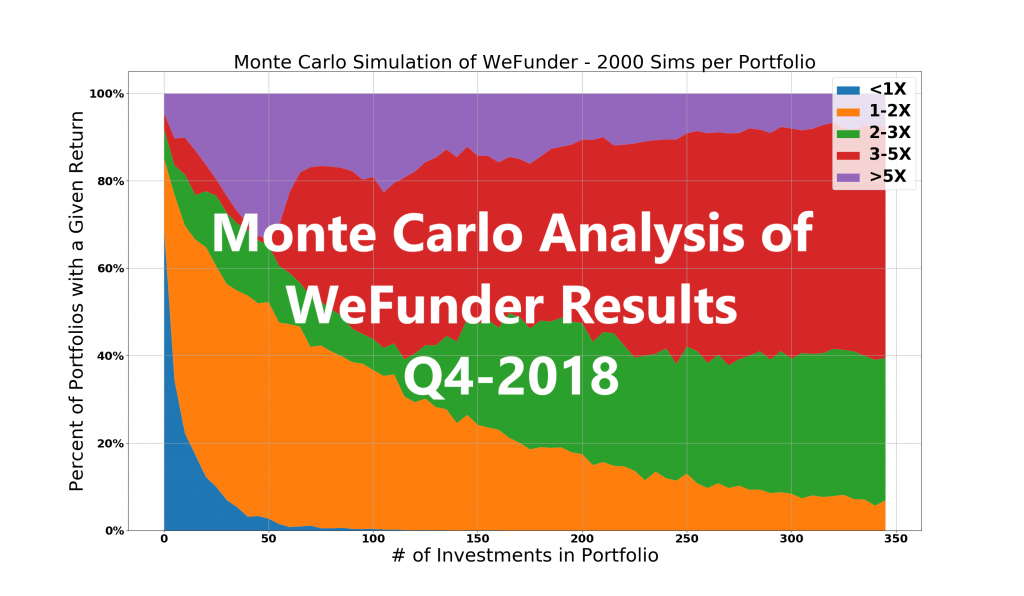
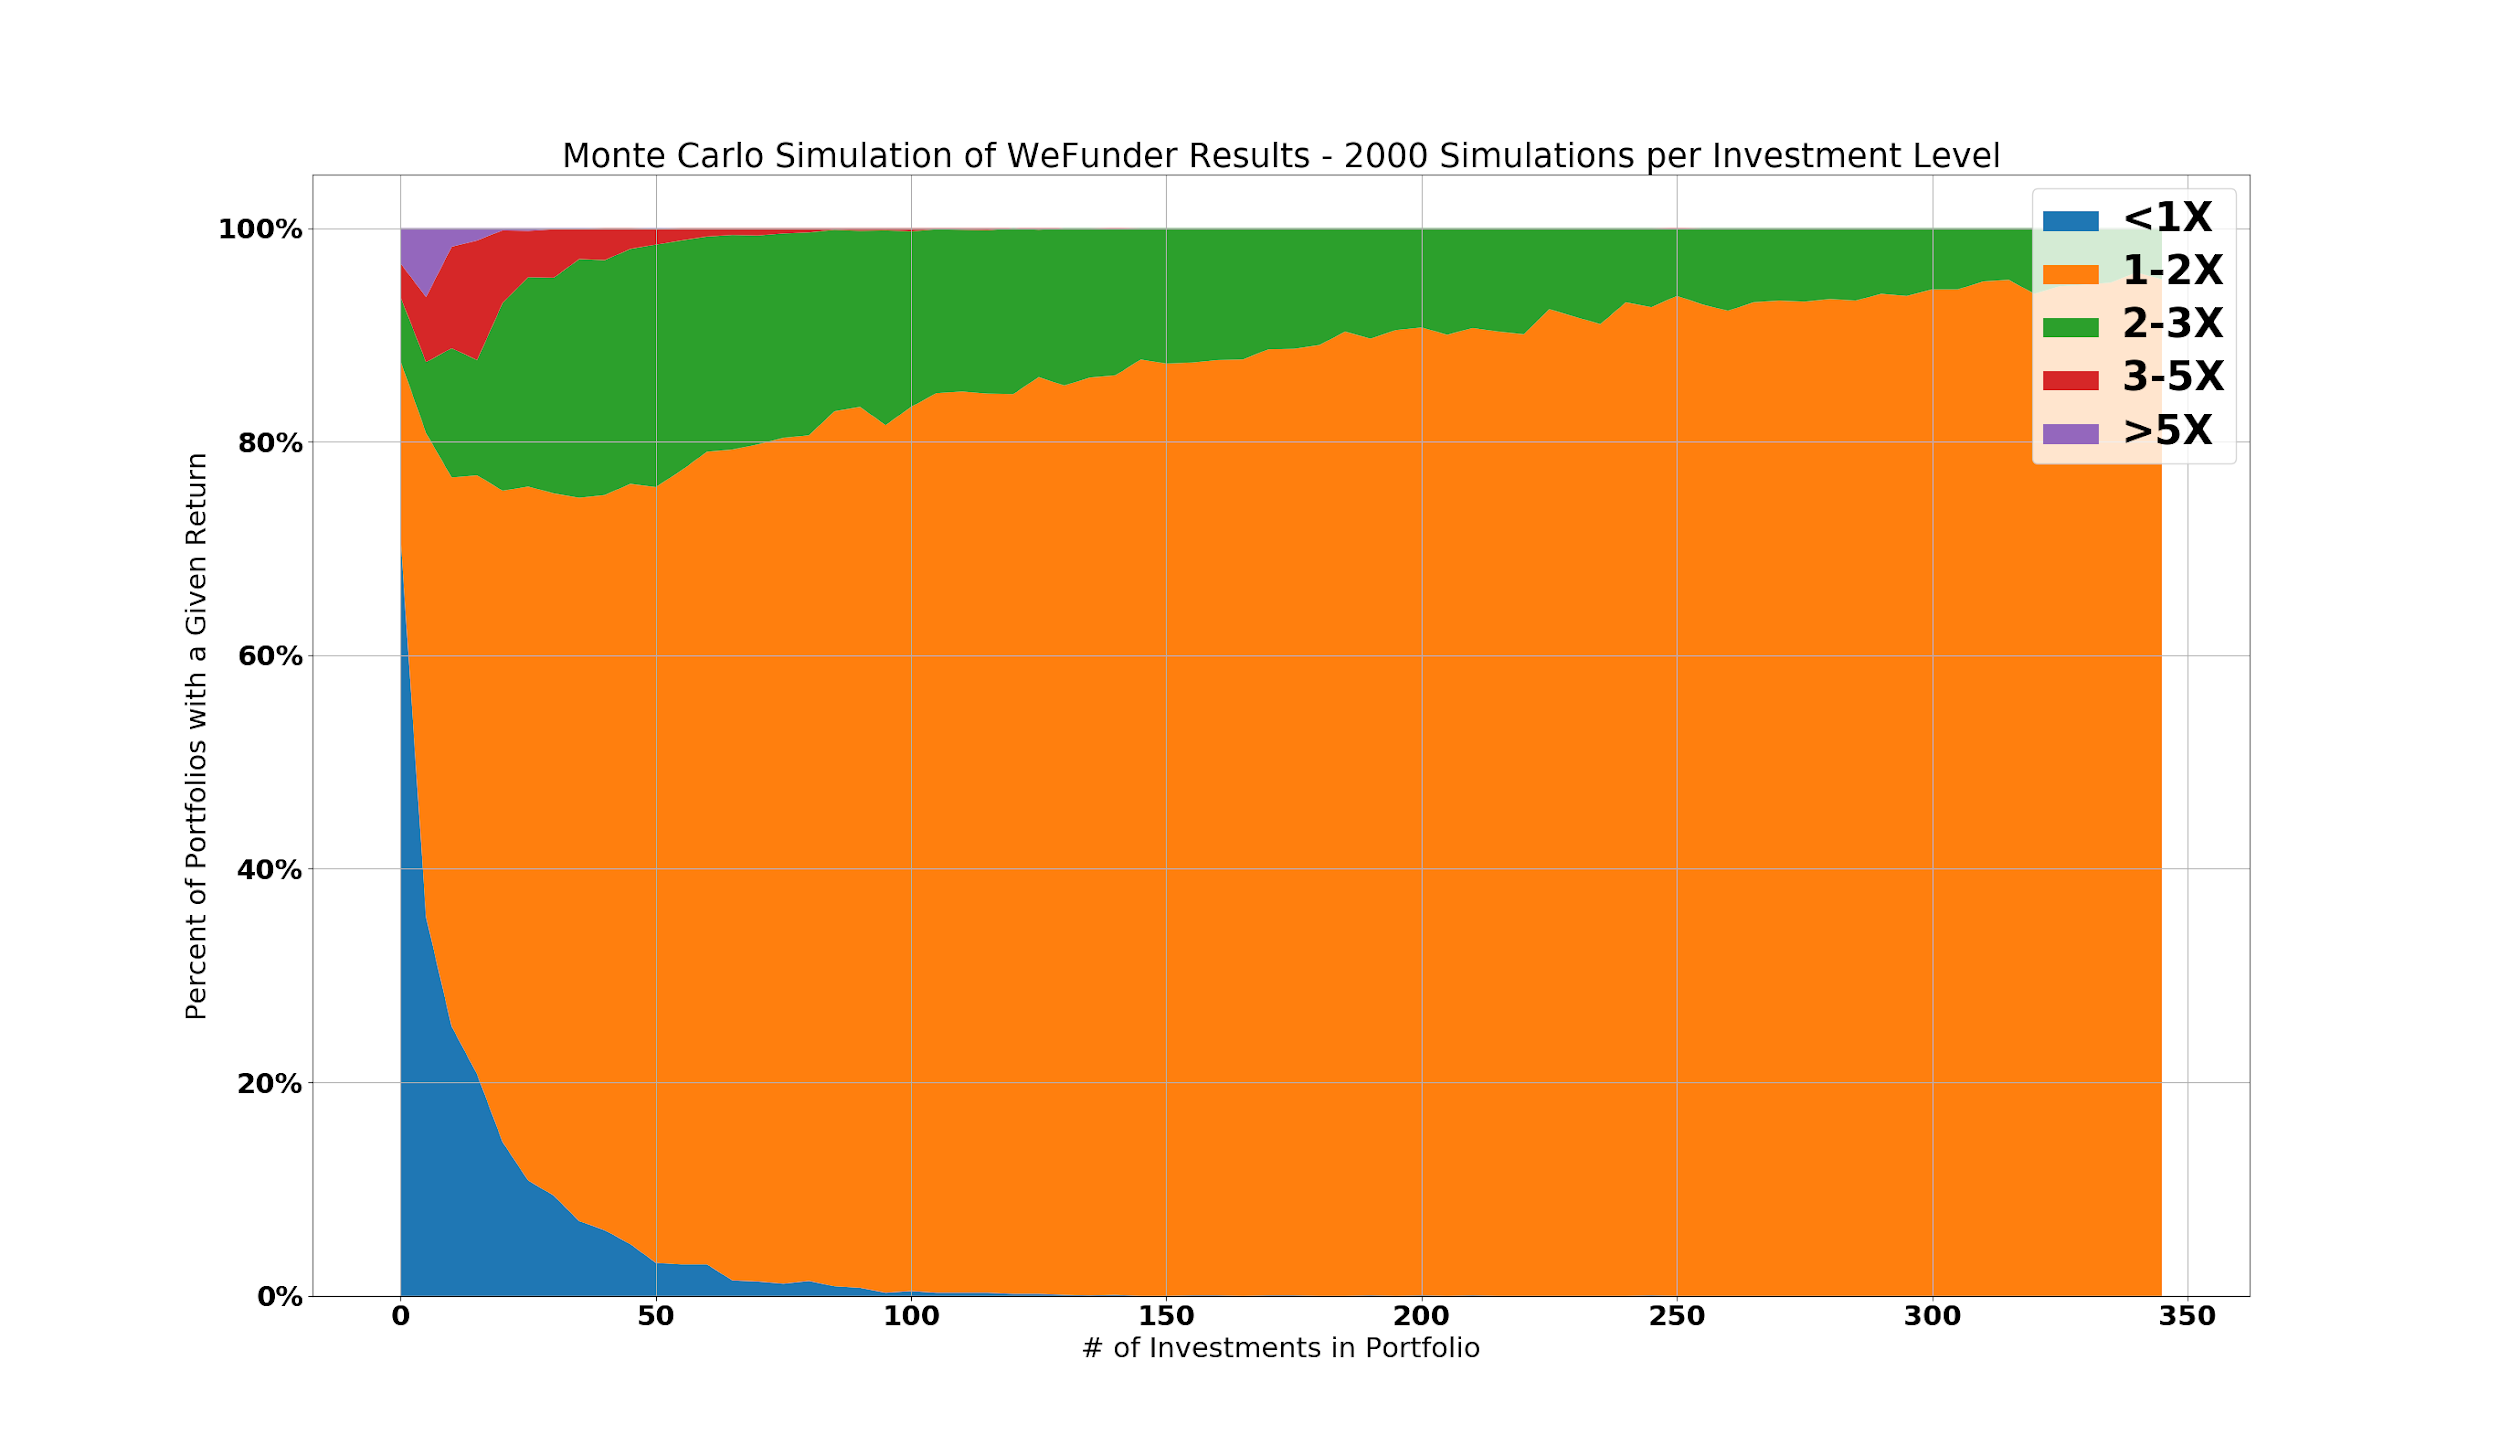
Probability of Returns vs. Number of Investments
Perhaps one of the best methods for visualizing the data is using a stacked chart that shows how expected returns (as a percentage of all the 2000 outcomes at each level) varies with numbers of investments.
For 2000 simulated runs at each number of investments (increments of 5), here is the distribution of portfolio returns observed.
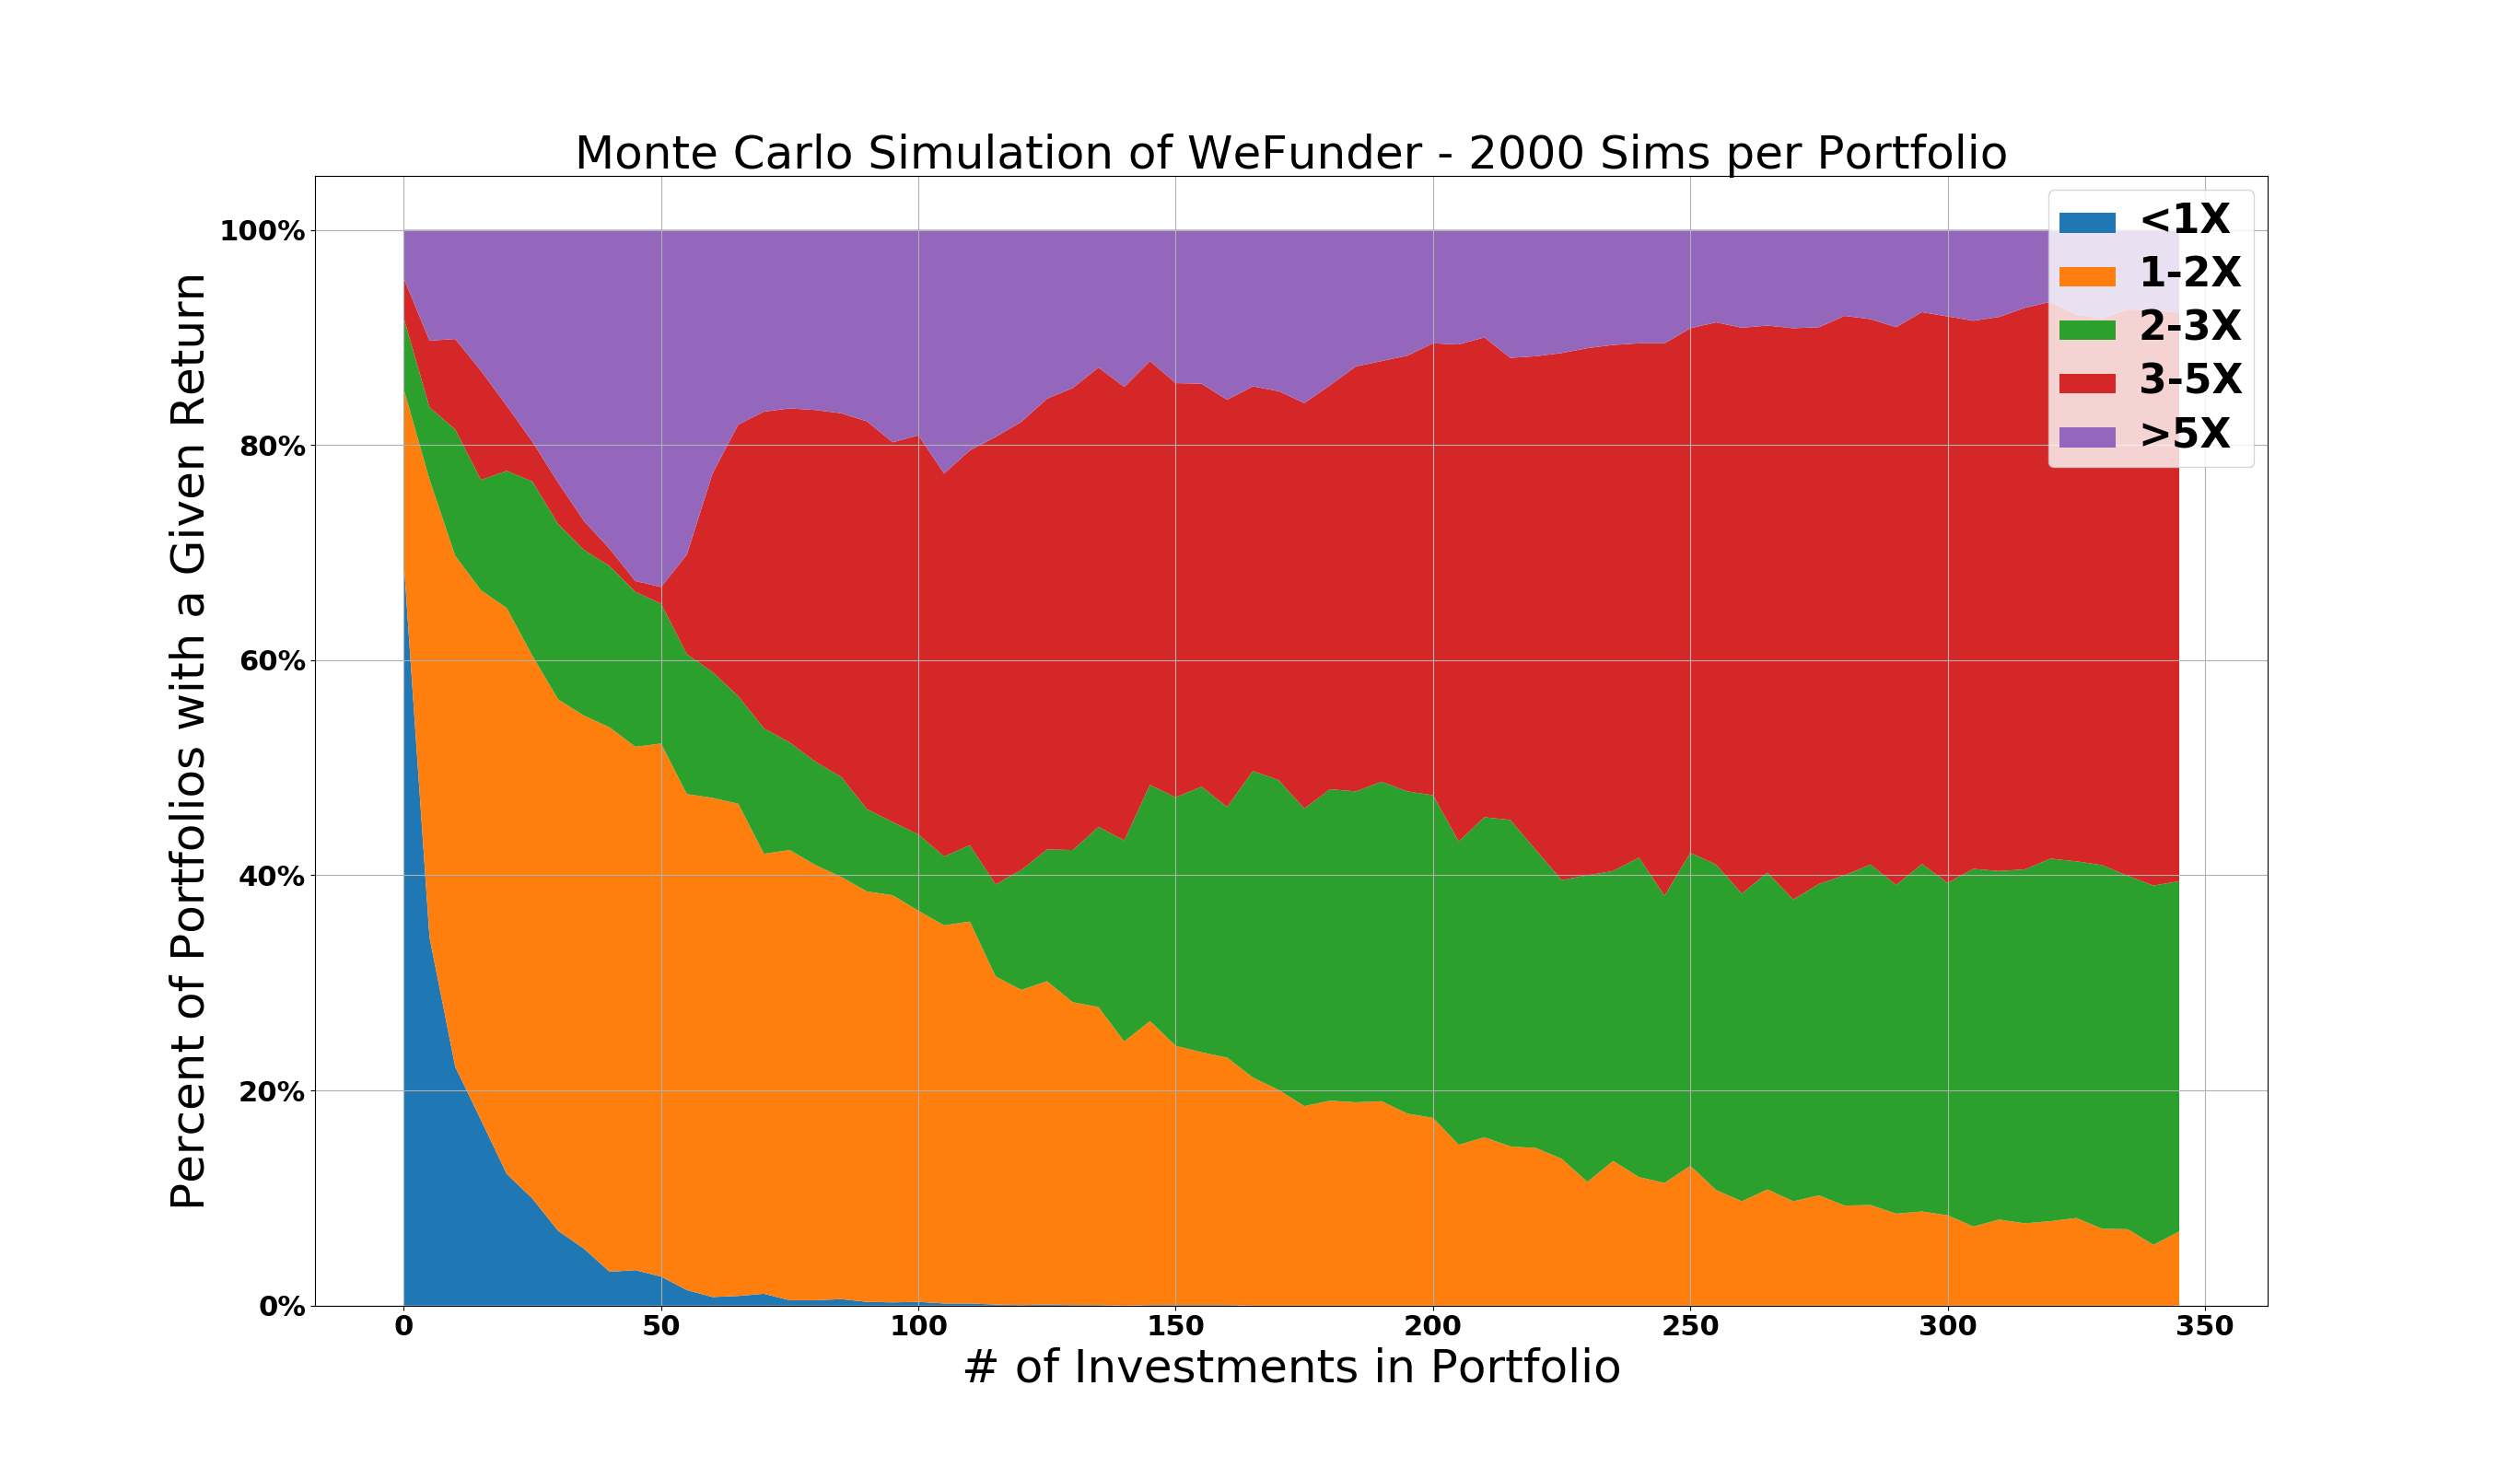
There is an obvious benefit of increasing portfolio size to boost expected returns.
Roughly 50 investments is the minimum number of investments if you want a 95% chance of returning more than 1X (i.e. at least breaking even).
The proportion of portfolios that returned 3-5X is relatively constant after 120 investments (again, remembering the WeFunder dataset had 119 samples).
Assuming that more companies with similar returns profiles were available to invest in, increasing investments beyond the current dataset limit of 120 investments would continue to boost the probability of returning more than 2X.
Monte Carlo Analysis – Model Overview and Assumptions
The Monte Carlo analysis that resulted in the above outputs was constructed in Python. Here are the primary assumptions:
- Assumes a random pick (generated by Python as a random integer from 1 to 119) for each investment in a portfolio
- Random integers are not removed from a dataset after selection. i.e. the model could randomly select “1” two times or more in a given portfolio, which would correspond to holding two (or more) Zenefits-type returns
- The number of investments are simulated from 1 to 350 at 5-number increments (e.g. 1, 6, 11, etc.). This was deemed sufficient in terms of resolution for plotting.
- 2000 Monte Carlo simulations are run at each investment level. This means 2000 simulations are run at 1 investment, 2000 more simulations at 6 investments, 2000 simulations at 11 investments, etc., until reaching the max of 350 investments.
- Results of each simulation are recorded and the overall portfolio returns are shown in the previous sections
Also, a few notes regarding the WeFunder dataset of 119 companies:
- Returns are currently unrealized, meaning that they are only a snapshot in time, and more likely will fail while others may increase in the return multiple over time
- Three of the companies (Ubiome, Equipment Share, and Goldbely) had undisclosed cash-on-cash returns. Using the most recent round of capital raised and several assumptions for dilution and current value of the shares, these were estimated for the dataset as follows:
- Ubiome = 15.8X
- Equipment Share = 5.0X
- Goldbely = 3.8X
- Visual representation of WeFunder unrealized returns to date are shown below
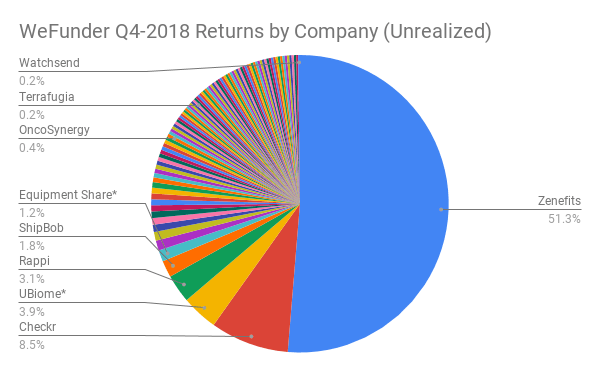
Understanding that one company – Zenefits – currently accounts for over 50% of WeFunder returns is a key point. For example, removing only Zenefits from the data and keeping the remainder of the returns as-is, here is the impact on expected outcomes:
For all portfolios with more than 80 investments, there is an 80%+ chance of only returning 1-2X capital. Contrast this with the previous charts that showed sufficient probability of returning 3-5X or even 5X+.
This is a crucial reminder to investors of the importance of power law returns.
Key Takeaways for Investors in Equity Crowdfunding
While the above charts can start to provide insights to equity crowdfund investors in terms of expected returns vs. portfolio size, there are two key takeaways.
1 – Increasing the Number of Companies you Invest in Boosts Potential Returns
Assuming that other equity crowdfunding and Reg CF outcomes will follow a similar pattern to the WeFunder Reg D data, and that you don’t have a magic formula that lets you know all the winners in advance, this tells us that increasing the number of companies boosts potential returns.
The equity crowdfunding data is remarkably consistent with Dave McClure’s observation that 50-100 investments is a more reasonable portfolio size, compared to many Angel Investors’ recommendations of 20-40:
“Most VC funds are far too concentrated in a small number (<20–40) of companies. The industry would be better served by doubling or tripling the average # of investments in a portfolio, particularly for early-stage investors where startup attrition is even greater. If unicorns happen only 1–2% of the time, it logically follows that portfolio size should include a minimum of 50–100+ companies in order to have a reasonable shot at capturing these elusive and mythical creatures.”
By increasing the number of your investments, you not only boost potential returns, but reduce the probability of your portfolio returning less than 1X. This can be thought of in a similar fashion to how casinos operate.
Like a casino, you want to see a high number of small bets, vs. a small number of large bets. This is why casinos have a limit on many tables; they know that over the long run, if you are placing many smaller bets, the slight advantage in house odds will pay out in their favor.
2 – Power Law Returns Dominate in Early-Stage Investing
Assuming that equity crowdfunding outcomes similar to Zenefits’ returns are roughly 1 in 100, it is imperative that:
- You are investing on funding portals that would both attract and allow for those types of companies to raise on.
- Your screening criteria isn’t eliminating potential Zenefits-type companies from being selected.
- You are investing in a sufficient number of deals to expose yourself to investing in a unicorn, such as Zenefits.
If an investor could select companies better than the completely random method of this Monte Carlo Analysis, it would result in higher overall returns; however, you must ensure you are still exposing yourself to the potential moonshots, which may look stupid or crazy at the time, and not eliminating those deals while simultaneously weeding out the failures.
Without those companies like Zenefits, the best you can expect based on the current data is 1-2X portfolio returns. Even the upper bound of 2X over 5 years is only equivalent to 13.9% annualized growth. That means you would probably be much safer investing in the public markets to achieve similar growth with much lower risk.
Remember:
playing to win and playing not to lose are not the same thing.
Differences to Keep in Mind
As a reminder, it is worth revisiting a few assumptions and limitations of the Monte Carlo Analysis presented here.
First, the WeFunder data is unrealized. This means that – on paper – this would simulate your returns to date. However, companies can (and will) still fail prior to successfully exiting. Alternatively, some companies may become much more wildly successful in the future, so the equity crowdfunding data is still maturing.
Second, the WeFunder data is Regulation D (accredited investors only) equity crowdfunding from 2013-2016. Whether Regulation Crowdfunding (Reg CF) outcomes will have similar returns is still to be seen. Besides the types of companies that may choose Reg CF over Reg D and the types of screening criteria that the funding portals require the companies to pass, there are also differences between Reg D and Reg CF deal terms (e.g. SAFEs are different between the two), that some funding portals, such as WeFunder, claim can impact the quality of startups that choose to raise on their platform.
Third, this analysis only gives you probabilities, not definitive outcomes. In the same way that a coin-flip has a 50-50 shot of heads vs. tails, but where you can have the unlikely event of 10 heads in a row, this analysis can only to be used to gain insights into the expected probabilities. It cannot provide you with definite outcomes.
Lastly, this assumes startups in each portfolio are picked randomly. While improving selection of high-potential startups and avoiding the losers can boost returns, investors must take care that they aren’t accidentally excluding the potential big winners as well. For example, looking for companies with strong current revenues and/or traction may be one way to weed out more losers, but if you are also weeding out those opportunities of huge winners with this filter, then it could hurt your overall portfolio returns.
Also remember, higher quantity (by itself) does not make up for quality. You must ensure you are increasing in more deals, but also doing so at a certain level of quality.
Future Plans for the Monte Carlo Model of Equity Crowdfunding
Now that we have a working Monte Carlo model, we will continue to analyze any equity crowdfunding datasets as they become available.
Whether this is from updates over time on WeFunder’s website, or if other funding portals decide to share results, we will pass the data through our model and see what conclusions, if any, can be drawn from the simulations.
If you come across a dataset that you would like analyzed, please send it along to [email protected]. Also, if you would like the location to the Python code stored on Bitbucket, send us an email and we are happy to share.
Questions, concerns, thoughts about this data? Feel free to post in the comments section below.


Responses