
What Financial Returns to Expect from Equity Crowdfunding

It’s no secret that investing in early-stage, private companies is extremely risky. As with any investment, investors need to balance this increased risk with an increased potential reward.
So what kind of financial returns should you expect – and demand – as an equity crowdfunding investor?
While equity crowdfunding is still in its infancy, we can look at a combination of past early-stage investment performance along with some current equity crowdfunding results to begin to build a picture of what types of returns investors might seek.
After all, if there is only a minor boost in returns offered between passive public market index funds and the active effort involved in screening equity crowdfunding deals, many investors will likely stick with ETFs and index funds.
First, we will look at some private market studies on Angel Investors and Early-Stage VCs that suggest early-stage investments have historically obtained an average ~26% Internal Rate of Return (IRR).
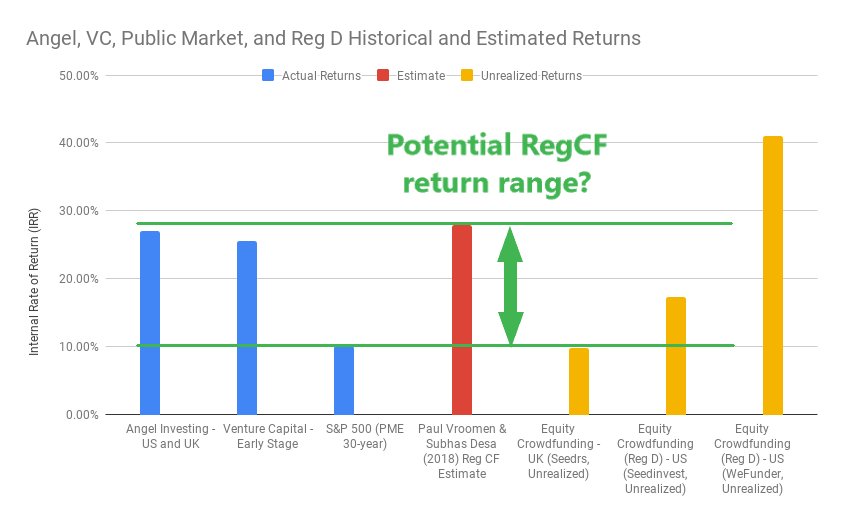
Next, since early-stage deals take 5-7+ years to exit, and because Title III equity crowdfunding (Reg CF) for non-accredited investors has only been around since May 2016, we will look at some UK and US Title II (Reg D) accredited investor equity crowdfunding data. While current unrealized IRRs range from 17%-41%, there is still much uncertainty that could impact future equity crowdfunding returns.
Lastly, we will wrap up by drawing some conclusions from all the presented data. We will highlight key differences that exist between the types of equity crowdfunding (Reg CF and Reg D). We will also surface some issues in the US legislation that must be overcome so as to attract the highest quality startups to equity crowdfunding portals.
As with everything on this site, remember that past performance is not a guarantee of future results. This data is for informational purposes only, and nothing written here should be construed as a recommendation to buy or sell any securities.
Summary of Private and Public Market Returns
Private vs. Public Market Historical Performance
To set the stage for the types of historical returns in the private and public markets, we looked at numerous studies for early-stage Angel and VC investors and compared them with 30-year public market equivalent (PME) for a representative index, the S&P 500.
Table 1 presents a summary of private vs. public market performance. Private market performance is aggregated from various studies and sources.
Type | Annual Return | Number of Investments | Date | Source |
Angel Investing – US and UK | 26.6%* | 120 – 3,097 | Up to 2009 | Right Side Capital Management – Angel Market Returns *Avg. IRR across 10 studies. IRR range 18-38% |
Venture Capital – Early Stage | 25.6% | 1161 | 1988-2018 | Cambridge Associates – 30 year, Early-Stage Index |
S&P 500 | 10.2% | – | 1988-2018 | Cambridge Associates – Modified Public Market Equivalent |
Table 1 – Historical performance data for Angel Investors, Venture Capital, and public markets (S&P 500)
Note the US and UK Angel Investing average annual return of 26.6% is close to the Early-Stage index calculated by Cambridge Associates of 25.6% for Venture Capital (VC).
When comparing this ~26% annualized private market return with the S&P 500 index 30-year average of 10.2%, the potential payoff of private market investing becomes apparent. Even the lowest IRR range of 17.6% from the Angel study significantly outperforms the public markets.
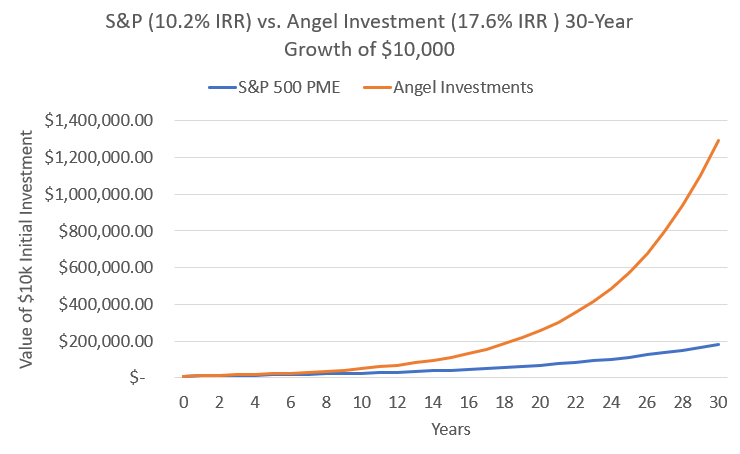
You might be thinking to yourself that an extra 7.4% growth each year doesn’t sound that game-changing. However, with the magic of compounding growth, an extra 7.4% annualized growth would be the difference between an initial $10,000 becoming $185,000 in the public markets vs. nearly $1.3 million in the private markets after 30 years of growth.
Granted, investors shouldn’t plan to put more than 5-10% of their total portfolio into early-stage investments because of the risks and the very large deviation in investor returns. However, for investors seeking outsized returns vs. public markets, it appears that angel investing may offer a chance for those who are dedicated.
Furthermore, if a little bit of luck is on your side and you end up closer to the average 26% annual return for private markets (or higher) – compounded over a 30-year period, that can result in massive differences in investment outcomes. If you started with $10,000 in your portfolio, a 26% IRR compounded annually would become $10.3 million after 30 years, while the 10.2% IRR would only turn $10k into $83,300 – a difference of 55.7X!
For the remainder of this article, we will dive deeper into the Angel investment data, rather than VC, due to Angel Investing having more similarities to equity crowdfunding compared to VC.
Angel investors – like equity crowdfund investors – are not typically full-time professionals, are investing their own money, and may be motivated by factors other than simply maximizing investor profits. In contrast, professional VCs do this for a living, invest other people’s money (e.g. Limited Partners), and get paid in fees as well as sharing in the profits.
Private vs. Public Markets – Differences

What are some reasons that the private market returns are so much higher than public markets?
There are several differences between early-stage private markets and public stocks. A few of the key differences to keep in mind are:
- Higher risk in early-stage: as expected, the higher return comes with a higher risk. In a 2007 study by Wiltbank & Boeker of 3097 Angel investments, 52% of investments returned less than 1X, while 7% of investments returned over 10X (return distributions that are expected for power law outcomes). This is because companies are very early in their life-cycles, and may not even have any customers at the time of raising capital.
- Less liquidity in early-stage: while stocks can be bought and sold with high liquidity on public exchanges, early-stage investments are highly illiquid – meaning capital is often tied up in the investment for 5-7+ years. Note: in the above 2007 study, the mean return multiple of 2.6X was held for an average of 3.5 years. However, this is likely skewed by the fact that failures happen more quickly, and the largest return multiples often take much longer.
- Deal flow and information asymmetry: while public markets like the Nasdaq are available to anyone that wishes to invest, private markets have traditionally been off limits to most investors. Investors depended on Angel networks and building their “deal flow” to even have the opportunity to invest. These private market inefficiencies are now changing with the recent equity crowdfunding legislation in the US, since deals are being made available to the public online.
While it is too early to tell whether Reg CF equity crowdfunding will have the same magnitude of risk vs. reward trade-offs, the higher risk and less liquid aspects of the investments are definitely true.
Angel Investment Performance Results
When assessing whether the 26.6% IRR for Angel investors from Table 1 may be used as an approximation for equity crowdfunding, there are several factors to take note of.
Range of Returns: among the studies covered in the Right Side Capital Management report for Angel investments, the calculated Internal Rate of Return (IRR) ranged from 17.6%-37.6%. This demonstrates that – even within Angel Investing – many factors can wildly influence potential outcomes.
Failure Rates: failure rates (i.e. investments that returned less than 1X) in the 2007 (US) and 2009 (UK) Wiltbank studies of 4000+ investments were 52% and 56%, respectively. For the same two studies, investments that returned >10X were 7% and 9% of the companies, respectively. This data suggests that we can expect >50% of the investments to return less than the capital invested, and a small percentage (<10%) of equity crowdfunding investments to win big (>10X). These assumptions are already being correlated by Reg D crowdfunding sites, such as the WeFunder data discussed below.
Holding periods: while the median holding periods for investments in the Wiltbank studies were 3.5 years, the failures tend to occur early in the startup’s life-cycle, while the big exits (e.g. IPOs) will take much longer. Thus, 3.5 years is likely too short of an estimate, as other studies tend to suggest Angel investment timelines closer to 5-8 years on average.
The figure below – generated from a 2007 study by the Ewing Marion Kauffman Foundation – confirms the trend that larger exit multiples take a longer number of years on average to exit. Keep in mind that IRR is time-sensitive, so having lower-multiple exits in earlier years can correspond to higher IRRs.

Angel Investing vs Equity Crowdfunding – Key Differences
While angel investors and equity crowdfunding investors both invest in early-stage businesses, there are some differences that will likely play a role in driving different returns for equity crowdfunding. These differences are not necessarily “good” or “bad”, but they will impact the investments in ways still to be seen.
Less direct influence on investment direction: Angel Investors often have direct contact with and influence on the founders and companies they invest in. If you are only investing smaller amounts (e.g. $100), you can’t expect the same type of direct exposure to your founders and startups. Thus, you will have less influence, whether through formal means (via voting rights, board positions, advisory roles, etc.) or informal means (via conversations with the founder, team meetings, etc.). This doesn’t mean equity crowdfund investors can’t have any impact (they can). We also shouldn’t ignore the potential that the sum of all crowdfund investors could have a larger impact than a single angel investor.
Limited access to due diligence: another consequence of making smaller investment amounts (e.g. $100 instead of $50k) is that investors shouldn’t expect any face time with a founder or team before investing, while many angels require this step as part of due diligence. You will have to perform due diligence primarily online. You will also likely scale the amount of time back as the investment capital at risk is also scaled back. i.e. It isn’t a good use of your time to spend 40 hours on due diligence if you’re only investing $50 (see our article on the due diligence vs. time tradeoff). It requires balance and will depend on each investor’s preferences, reasons for investing, and amount of capital.
Lack of pro-rata rights: whether angels choose to exercise them or not, they typically have pro-rata rights. This gives them the option, though not the obligation, to invest alongside larger investors in future rounds. In equity crowdfunding, pro-rata rights thresholds are commonly on the order of $25,000 or more, so don’t expect to be able to purchase additional shares and double down if your investments are winning. Note: even among angels, whether to use pro-rata rights and how it impacts potential future returns is usually up for debate. Wiltbank’s 2009 study in the UK found that “Making follow-on investments is significantly related to lower returns.” Again – the lack of pro-rata rights may not be a bad thing, but it is different.
Deal flow and geographic diversification: one of the potential benefits that equity crowdfunding offers over angel investing is that the democratization of public offerings online means that anyone anywhere can invest in the offerings. Thus, deals that may have previously been geographically unavailable to investors, or only available through an angel network, will now be available to everyone.
While the above differences are not necessarily positive or negative, keep these nuances in mind when comparing angel investment returns with expectations for your equity crowdfunding portfolio.
Equity Crowdfunding (Reg D) Returns to Date
With a solid foundation thus far from the public and private market data, let’s look at some current US and UK data for equity crowdfunding websites.
For the US data, these equity crowdfunding deals are Title II (Reg D), and have some key differences from the current Title III (Reg CF) legislation. To read more about the potential limitations and differences, check out the WeFunder letter from 2016 addressing some current shortcomings and risks to Reg CF investors. As of December 2018, this has been passed by the House but is still awaiting the vote in the Senate.
From US and UK equity crowdfunding platforms that reported IRRs, below is a summary of returns. AngelList, a leading accredited investor platform that uses syndicates and is slightly different from traditional Reg D crowdfunding, has also been included for reference.
Type | Annual Return | Number of Investments | Date | Source |
AngelList Syndicates | 46%* | – | 2013-2016 | AngelList 2016 returns report, after fees and carry |
Equity Crowdfunding (Reg D) – US | 41%* | 119 | 2013-Present | WeFunder.com/results Three unicorns (Zenefits, Ginkgo Bioworks, Rappi) |
Equity Crowdfunding (Reg D) – US | 17.4%* | – | 2013-2017 | Seedinvest (acq. by Circle) |
Equity Crowdfunding – UK | 9.84%* | 100+ | 2013-Present | Seedrs 2018 – All Investors w/ >100 investments. Pre-tax |
Equity Crowdfunding – UK | 20.78%* | 20+ | 2012-Present | Seedrs 2018 – Top Quartile w/ >20 investments. Pre-tax |
Equity Crowdfunding – UK | 13.27%* | – | 2012-2016 | CrowdCube Results |
White Paper Estimate – Crowdfunding | 28% | June 2018 | Paul Vroomen & Subhas Desa (2018) Rates of return for crowdfunding portfolios: theoretical derivation and implications, Venture Capital, |
Table 2 – Equity crowdfunding returns to date from various US and UK funding portals. *These published IRRs are unrealized gains and will still likely change as a function of both time and startup exits
The first observation the reader can make is how wide the range is for these unrealized returns.
In 2016, AngelList syndicates reported a 46% IRR, after fees and carry.
The UK platform Seedrs has seen average investment returns of 9.84% IRR across all portfolios with 100+ investments, while seeing 20.78% IRRs in the top quartile of investors. CrowdCube, another UK platform, reported 13.27% for all investments for the period of 2012-2016.
In the US, Reg D offerings on WeFunder have resulted in a 41% IRR (adjusted down from 53% in mid-2018), while Seedinvest (now Circle) posted a 17.4% IRR in 2017.
For WeFunder, it is interesting to note that just one investment of the 119 startups (Zenefits) accounts for 55% of the total WeFunder returns. This is remarkably consistent with power law returns following an 80/20 rule, which would state that 1 in 125 (0.2^3) investments would return 51% (0.8^3) of total returns.
Also, a paper published in June 2018 by Paul Vroomen & Subhas Desa looked at historical returns and efficient market theory to apply lessons and models to potential equity crowdfunding returns. They found that an efficient crowdfunding portfolio can anticipate a 28% IRR with 99% confidence. While some of the underlying assumptions may not be entirely valid – a subject for a future post – this estimate is consistent with the previous early-stage private market returns and available Angel performance data showing ~26% IRR.
Conclusions from US and UK Equity Crowdfunding Returns to Date
It’s still early: even for Reg D, which has been around in the US since 2013, the fact that these are unrealized gains means they will continue to change as the vintage of investments ages and additional exits (and failures) are realized. The IRR is also a time-sensitive calculation, so the calculated IRR will continue to change as time goes on.
Power laws drive returns: as shown with Zenefits on WeFunder, the returns are dependent on very few of the deals returning the majority of platform’s returns. If you had invested in 118 deals and only missed the one Zenefits deal, that would have dropped your total returns on WeFunder from a 41% IRR to a ~12% IRR. Zenefits accounts for nearly 55% of total WeFunder gains today. Thus, it will be imperative that Reg CF allows for and attracts those types of potential companies to do offerings, that those companies pass the funding portals’ due diligence processes, and that investors maintain diversified portfolios with a sufficient number of investments to expose them to these power law returns.
Taxes can have a huge impact on returns: especially in the UK, investors are granted huge tax advantages for investing in equity crowdfunding. When taking those tax advantages into account, it is the difference of going from 9.84% IRR to 24.43% IRR (tax adjusted) for the exact same portfolios with over 100 investments. We will have to keep a close eye on the US tax code and potential impacts when looking at equity crowdfunding returns.
Putting it All Together – What it Means for Early Reg CF Investors
In summary, we have seen the following annual returns from past and present data:
- Early-Stage Angel studies (100+ investments) = 17.6% – 37.6%
- Public Markets = 10.2% (S&P 500, 30 year public market equivalent)
- Reg D Equity Crowdfunding = 17.4% – 41% (only two data points, WeFunder and Seedinvest)
Assuming that the Reg CF market will compensate investors by providing higher gains for the additional risk, one could hypothesize that the conservative lower bound on potential returns would be the public-market equivalent of 10.2%. For the upper bound, assuming a portfolio of >100 investments and similar outcomes to Angel investments, the average IRR from Angel Investors of ~27% may be representative. A more conservative estimate may postulate that the best returns equity crowdfunding will see is the lowest from the Angel studies at 17.4%.
However, the exact details for Reg CF investments will still need to be observed. Returns not only vary widely for Angel Investors, but also vary widely on Reg D equity crowdfunding portals.
Assuming that Reg CF investments will mimic the early-stage returns seen by Angels and on equity crowdfunding platforms is also suspect with the current legislation. Reg CF proponents are currently pushing for a JOBS Act 3.0 to pass the Senate, which would clear up some current obstacles that are keeping Reg CF from having the same potential as Reg D investments, such as Special Purpose Vehicles (SPVs) and the 12(g) exemption.
Three Important Risk vs. Return Questions to Reflect On
Due to the inherent risks and the time that will be required to screen deals and maintain the quality level of your investments, three questions you should ask yourself include:
- What do I believe the likelihood is of achieving returns on par with historical data, and what returns do I think are likely for equity crowdfunding?
- Is the potential gain in rewards that I expect from #1 worth the added risk to my portfolio (remembering that over 50% of deals will fail)?
- Do I have the required time to commit to screening deals to the level of quality that will be required for my desired returns, and to have enough investments sufficient to diversify my risk?
For example, if the lower-bound estimate from Angel Investing of 17.6% IRR was the return you could expect in equity crowdfunding (and close to Seedinvest’s return of 17.4%), would you see the value in all the extra effort required just to get a ~7% boost over the 10.2% passive returns you could get from the public markets with less effort and risk?
The coming years will be interesting as we monitor whether equity crowdfunding can live up to the high expectations of both investors and startups.
Also keep in mind that while financial investing is one reason to invest, there are also many other reasons that may play into your decision to invest in equity crowdfunding.
Learn more about investing in equity crowdfunding by creating an account and gaining access to 6+ hours of startup investor courses – completely free!


[…] never invest more than you are wiling to lose. But, why invest? With an average of 26% average IRR (http://crowdwise.org/data-analysis/equity-crowdfunding-returns/) over a 30 year period, there is plenty of potential to be had. The key thing here as with any […]
[…] specific company in mind, but as we’re now entering year five of Reg CF – and since the average time to exit for angel investments tends to be 5-8 years – I’m hopeful that 2021 will bring one (or more) of the Reg CF companies who launched in the […]
[…] talking will most likely find yourself nugatory (although as a well-diversified portfolio, could outperform the public markets). Bonus shares ought to be used as a part of an general startup investment portfolio approach the […]
[…] #3 – the potential returns – we used a range of average portfolio IRRs from angel investing and early-stage VC data and assumed an average five-year exit timeline. These overall portfolio IRRs account for failure […]
[…] in thoughts, however as we’re now coming into yr 5 of Reg CF – and for the reason that moderate time to go out for angel investments has a tendency to be 5-8 years – I’m hopeful that 2021 will deliver one (or extra) of the Reg CF corporations who introduced […]
[…] more than likely finally end up nugatory (regardless that as a well-diversified portfolio, might outperform the general public markets). Bonus stocks will have to be used as a part of an total startup funding portfolio way the place […]
[…] For the sake of the comparison, let’s assume both investors are targeting a 27% annual rate of return, the average for Angels from numerous studies. […]